Home Servers, AArch64, and You (well, me)

Recently, my SoftIron OverDrive1000 arrived, and I’ve finally given myself some time to sit down and implement the project I purchased it for. First, one may ask, why AArch64? The answer lies in my history of installing Linux-based machines at home, the number of PowerPC machines still exceeds the number of x86/x86-64 machines that I have done. So when I got the chance to pick up some AArch64 hardware that came in a regular form factor, I decided to jump on it. The other reason is that, as I have joked with some people, I like to do things the hard way. What do I mean by that? Well, I’ll explain. But first, some background.

The hardware comes with openSUSE Leap 42.2 preinstalled. I decided to take the fact that this is the least familiar distribution to me as a challenge. At the same time, I also decided that it would be worth evaluating other distributions that I’m familiar with, such as CentOS and Debian, on AArch64. Most of what I do with my home server today is related to locally streaming media. So while I had been installing and running various applications directly (making use of crontab’s @reboot keyword to launch them), I decided I should move on to modern best practices and use Docker to isolate, control, and update these applications. Finally, while I’ve been using Rygel for a few months, I want to get back to using Plex Media Server to serve the content. This in turn introduces the constraint of needing to use a 32-bit ARM binary, as Plex currently does not have a 64-bit build available.

The first bit of fun I found was that while the Docker project has community provided support for AArch64, Docker, Inc does not actually provide AArch64 builds. So if you want to have the most up to date Docker installation and wish to have Docker be managed by your distribution packaging manager, there’s some work to be done. The Docker project does have some contrib scripts to create packages of Docker for many distributions, but they’re written assuming that you’re running on x86-64. The good news is that all 3 of the distributions mentioned above do ship a version of Docker. For my needs (a well firewalled internal server), the versions they provide are OK.

Testing on CentOS proved interesting. It was easy to get it installed and running from a spare drive on the real hardware. This was just as easy and boring as advertised. After checking basic functionality, I switched to running it in a virtual machine for the rest of my tests. Here’s where things got difficult. First, as of today, CentOS uses 64K pages rather than 4K pages. This in turn disallows the possibility of having 32-bit binary compatibility. One can recompile the CentOS kernel to change the page size and get 32-bit compatibility working. I did this and it proved straightforward yet time consuming. After confirming that this was enough to enable at least basic 32-bit compatibility, I decided to move on.

Debian was the next distribution that I tried out. While the Debian wiki says that you need a newer image to install on AMD Seattle hardware such as the Overdrive 1000, the latest Jessie images are actually new enough to boot and start the installer. At this point in my experiments I didn’t want do another install on the hardware, so the rest of my tests were done on a virtual machine install. This installation didn’t work out well for me and my needs, unfortunately. While there is a docker-engine package available which is used by 96boards.org, I didn’t want to introduce such a large deviation from upstream Debian. The docker.io package exists as a backport to Jessie, but not for arm64. Further, at the time that I was testing things, Sid was in an incomplete state for the docker.io package. While I was able to resolve the dependencies manually, Docker didn’t want to start. I should note that I’m doing my reviews here out of order slightly. At this point I had openSUSE with Docker running, and didn’t want to further dive into this problem, which I’m sure could be resolved. One last note is that I did test 32-bit compatibility, and it works fine on Debian out of the box.

Which brings me back to openSUSE. The main repository has Docker available, and the kernel is already built with 32-bit compatibility enabled. This was the easiest distribution for getting the first order of problems solved on, as everything just worked, and I was also able to easily set up VMs for testing the other distributions. The biggest hurdle I faced on openSUSE is that I didn’t find a lot of documentation about installing Docker, but instead about setting up various flavours of LXC. Fortunately, Docker is not very host distribution specific, so this was not a big problem.

All of the above distributions, and other efforts such as the Linaro distributions for the Dragonboard, suffer from one more issue with respect to running Docker containers consisting of 32-bit binaries. Namely, that we’re not using binaries that we’ve controlled the build process of, we’re just picking up whatever is in various public containers from Docker. Without getting too deep into the technical details of what instructions AArch64 will emulate, not all instructions required to run “armhf” binaries are required. For example, a number of Docker images are built optimized to the ARMv6 architecture as found in some models of the Raspberry Pi, and these instructions require additional Linux kernel support to be enabled. For more details see here.

So, where does that leave us? Well, first of all, I’ve completed the software side of the desired migration. The new server is doing everything the old server was doing before. As far as my end users go, it’s all working just as well as before too. In doing this migration, I’ve been reminded of the phrase “the more things change, the more they stay the same”. Back during the early Linux on PowerPC days, one would often have to deal with the problems induced by “Linux” really meaning “Linux on 32-bit Intel/x86 compatible CPUs” to some project or maintainer. Today one has to deal with the problem of “Linux” often meaning “Linux on 64-bit Intel/AMD x86-64 compatible systems” with an occasional “Linux on the Raspberry Pi” instead. Both of these assumptions make life interesting at times. With the former, for example, it is possible to have Docker images deal with multiple architectures, but that’s just not done today. I suspect that while it will be done for the core Docker images at some point, one is always going to need to take care when using arbitrary community images, setting aside any other concerns one might have in that area. With the latter assumption, we run into the kernel issue mentioned above, as without the Pi, “armhf” would likely mean “ARMv7” in practice. In the end, the cool thing here is that the distributions have achieved pretty close to parity between x86-64 and AArch64 in terms of the offered software. However, once you start to move out of that garden and into the world at large, you’re going to start to find some oddities. Now, if you’re like me and find the challenge fun, or are looking for a reason to dive deeper into how things work, it’s a great time and a great idea. But if you’re looking for a turn-key solution on an AArch64 platform, things aren’t quite there yet.

Tool Time: Quilt

All of us have our favorite tools and workflows. For me, I am a fan of git. One of the things I really like about it is git stash, because it lets me keep drafts of my changes and develop them incrementally. But there are times where you need to adapt your workflow to fit within the requirements your customer provides. For example, I’m working with subversion currently with a customer. And while I’m familiar with git-svn, it’s not always the right choice. So I dug around in my toolbox and found quilt from my pre-git days. It’s not quite the same as my usual workflow, but with a minimal of mental gymnastics I’m productive and working rather than fighting with my tools.

Here’s my quick guide to getting started using quilt. As a first step it’s worth looking at the quilt sub-commands:

$ quilt help
Usage: quilt [--trace[=verbose]] [--quiltrc=XX] command [-h] ...
       quilt --version
Commands are:
        add       fold    new       remove    top
        annotate  fork    next      rename    unapplied
        applied   graph   patches   revert    upgrade
        delete    grep    pop       series
        diff      header  previous  setup
        edit      import  push      shell
        files     mail    refresh   snapshot

Global options:

--trace
        Runs the command in bash trace mode (-x). For internal debugging.

--quiltrc file
        Use the specified configuration file instead of ~/.quiltrc (or
        /etc/quilt.quiltrc if ~/.quiltrc does not exist).  See the pdf
        documentation for details about its possible contents.  The
        special value "-" causes quilt not to read any configuration
        file.

--version
        Print the version number and exit immediately.

Some of these are going to look familiar. This is because quilt was one of the inspirations for git. Some of the commands are a little different. For example, quilt fold is the equivalent of doing git rebase –interactive and using the squash and fixup keywords. Using quilt header is like setting your commit message when you git commit your changes. It even has quilt snapshot, which behaves like git stash, but I’m going to set it aside in favor or making new patches as I go. With all of this covered, it’s time to show a sample workflow:

$ quilt new first.patch
Patch first.patch is now on top
$ quilt add src/stuff.c
File src/stuff.c added to patch first.patch
$ ${EDITOR} src/stuff.c
$ quilt refresh
Refreshed patch first.patch
$ quilt new second.patch
Patch second.patch is now on top
$ quilt add src/stuff.c
File src/stuff.c added to patch second.patch
$ # ... and so on

What you’ll notice from the commands is what I feel is the hard part of this work flow, you must tell quilt what to track. Because it’s not your revision control system, quilt doesn’t know what the original state of a file is before you change it. However, with a little time you’ll be doing quilt new, quilt edit and quilt refresh without a second thought.

One noteworthy thing about quilt is the workflow for reviewing your changes. To see what your current patch looks like compared with the state of the tree prior to any changes, you do quilt diff. Note that this is akin to git diff HEAD in that it will disregard changes made since your last quilt refresh. To get the same type of output as git diff, you do quilt diff -z. When you wish to review your series of changes quilt pop will unapply the current patch, and quilt push will apply the next patch in your series. quilt series will list all patches in the series with quilt next, and quilt previous lists the next and previous patches in the series, respectively.

Developing on hardware without functional networking

One of the more painful steps in doing development on hardware is when you don’t have any networking that’s functional and reliable yet. So you end up having to shuffle a SD card, USB stick, or similar back and forth. This can be even less fun when you’re working on a prototype, and need to take care to avoid disconnecting a fragile collection of boards, wires, and cables.

While there are a few different ways to get around this problem, depending on what is and isn’t working, my current favorite is wireless enabled SD cards. Why? One reason is that they’re OS-independent. So long as the board can supply power the card will be able to bringup its network. Break booting into Linux with your latest change? Not a problem. Want to integrate with your existing build cycle? There are CLI tools, and at the end of the day you’re sending stuff via HTTP to the card so you can always write something yourself if you don’t like what you find for tooling. The biggest drawback to me is that it only supports exposing the first FAT partition, but on the other hand you can happily partition the card and there is no requirement on where the FAT partition physically resides.

To make the best use of these cards, there are a few tricks you will want to employ. And while everything is documented, I found it handy to make up some templates to work with when I was setting up my lab with a few cards. On each card I would leave the VERSION and CID fields alone as they are pre-populated, and then overwrite the rest of the contents based on my template, fill it in, and go. My template looks like:

[WLANSD]

DHCP_Enabled=NO
IP_Address=192.168.0.XXX
Subnet_Mask=255.255.255.0
Default_Gateway=192.168.0.1
Preferred_DNS_Server=192.168.0.1
Alternate_DNS_Server=8.8.8.8

[Vendor]

CIPATH=/DCIM/100__TSB/FA000001.JPG
PRODUCT=FlashAir
VENDOR=TOSHIBA
WEBDAV=1
TIMEZONE=-28
APPSSID=MY-LOCAL-SSID
APPNETWORKKEY=MY-LOCAL-SSID-PASSPHRASE
APPNAME=flashair-XXX
APPMODE=5
APPAUTOTIME=300000
DNSMODE=0
LOCK=1
UPLOAD=1
WLANAPMODE=0x82

A few of these choices are odd enough that they are worth explaining. First, while the cards can happily do DHCP, I don’t like relying on that in cases like this. I’m much happier to instead put the card in a case with a sticky note on top that notes the IP, for the next project I need it for. Next, I set APPMODE to 5 so that it will join my network rather than start its own. The TIMEZONE key is a little odd. It is UTC based but works in 15 minute increments, which can be useful, but is somewhat unexpected. Note that if you do not spell out UPLOAD=1 uploading of files is disabled. The default upload path is the root, and that is often what we will want. Finally, I have WLANAPMODE set to the value for 802.11n/g rather than the default of 802.11b/g. It is also worth noting that once the card has run with this config file, it will update and asterisk out your network passphrase.

At the end of the day, I like these, and have a number of them because they’re so versatile. They come in sizes up to 32GB, which is enough to have a pretty well featured distribution available; either for the board itself, or to chroot into during development to easily add perf or other tools to a stripped down system. They are a full-size SD card but that’s just an adapter away from fitting into a microSD slot which is how I use about half of mine. And if you don’t have a spare (or functional yet) SD slot a USB card reader works just as well to bring this into the system you’re working on.

Supporting Flame Graphs on production kernels

Background

Perf is an amazing tool for observing system performance in Linux. Using perf on production kernels can be filled with pitfalls, due to the rapid pace at which new features are being added. In my case, I support a production kernel team that expects every feature they read about on the web to work on their older production kernel. A good example of a downstream use case of perf is Brendan Gregg’s very nice Flame Graphs tool for visualizing frequently used code paths in a system.

Example mysql Flame Graph

Example mysql Flame Graph

Recording call frame information with perf

Generation of Flame Graphs depends on perf capturing call frames. As documented in the Flame Graph tools, one records perf data on a x86-64 system by enabling DWARF call graph support with a command line like:

$ perf record -F 99 -a --call-graph dwarf -- sleep 60

That, of course, produces the raw perf.data file. The call frames we need are there. However, we need to process this data with a reporting tool.

Problems generating Flame Graphs

Now we start running into the problem with our production kernel. In our case, we are on a 4.1 kernel. Users are happily running perf report, seeing the complete set of call frame information throughout the system components under observation. The interesting thing is that if we generate a Flame Graph using this same data, then the users no longer have visibility into the complete calling tree information. That is, the Flame Graph will simply show time spent in a given library. So what’s wrong? Let’s take a look at how Flame Graphs are generated:

$ perf script > out.perf
$ stackcollapse-perf.pl out.perf > out.folded
$ flamegraph.pl out.folded > out.svg

The key here is that we are no longer parsing the perf data using perf report, but rather using perf script to do the heavy lifting and feeding the result into the Flame Graph generation tools. Doing a bit of git detective work, we can see that perf report added callchain sampling all the way back in 3.18:

$ git describe --contains 0cdccac6fe4b1316f04f0dbfcc4efab51932014a
v3.18-rc1~8^2~2^2~6
$ git log -1 -p 0cdccac6fe4b1316f04f0dbfcc4efab51932014a
commit 0cdccac6fe4b1316f04f0dbfcc4efab51932014a
Author: Namhyung Kim <[email protected]>
Date:   Mon Oct 6 09:45:59 2014 +0900

    perf report: Set callchain_param.record_mode for future use

    Normally the callchain_param.record_mode is used only for record path.
    But as it might need to prepare something for dwarf unwinding, setup
    this info for perf report too.

    Signed-off-by: Namhyung Kim <[email protected]>
    Acked-by: Jiri Olsa <[email protected]>
    Cc: David Ahern <[email protected]>
    Cc: Frederic Weisbecker <[email protected]>
    Cc: Ingo Molnar <[email protected]>
    Cc: Jean Pihet <[email protected]>
    Cc: Jiri Olsa <[email protected]>
    Cc: Namhyung Kim <[email protected]>
    Cc: Paul Mackerras <[email protected]>
    Cc: Peter Zijlstra <[email protected]>
    Link: http://lkml.kernel.org/r/[email protected]
    Signed-off-by: Arnaldo Carvalho de Melo <[email protected]>

diff --git a/tools/perf/builtin-report.c b/tools/perf/builtin-report.c
index 2cfc4b93..140a6cd 100644
--- a/tools/perf/builtin-report.c
+++ b/tools/perf/builtin-report.c
@@ -257,6 +257,13 @@ static int report__setup_sample_type(struct report *rep)
                }
        }

+       if (symbol_conf.use_callchain || symbol_conf.cumulate_callchain) {
+               if ((sample_type & PERF_SAMPLE_REGS_USER) &&
+                   (sample_type & PERF_SAMPLE_STACK_USER))
+                       callchain_param.record_mode = CALLCHAIN_DWARF;
+               else
+                       callchain_param.record_mode = CALLCHAIN_FP;
+       }
        return 0;
 }

diff --git a/tools/perf/tests/dwarf-unwind.c b/tools/perf/tests/dwarf-unwind.c
index 96adb73..fc25e57 100644
--- a/tools/perf/tests/dwarf-unwind.c
+++ b/tools/perf/tests/dwarf-unwind.c
@@ -9,6 +9,7 @@
 #include "perf_regs.h"
 #include "map.h"
 #include "thread.h"
+#include "callchain.h"

 static int mmap_handler(struct perf_tool *tool __maybe_unused,
                        union perf_event *event,
@@ -120,6 +121,8 @@ int test__dwarf_unwind(void)
                return -1;
        }

+       callchain_param.record_mode = CALLCHAIN_DWARF;
+
        if (init_live_machine(machine)) {
                pr_err("Could not init machinen");
                goto out;

Making Flame Graphs work with our kernel

Knowing that this worked on newer versions of perf in at least the 4.6 kernel, we were then able to spot that it wasn’t until 4.3 that perf script gained callchain support. Notice the addition of the analogous code to what was already in perf report:

$ git describe --contains 7322d6c98dd214252bd697f8dde64a3576977fab
v4.3-rc1~138^2~5^2~10
$ git log -1 -p 7322d6c98dd214252bd697f8dde64a3576977fab
commit 7322d6c98dd214252bd697f8dde64a3576977fab
Author: Jiri Olsa <[email protected]>
Date:   Thu Aug 13 09:17:24 2015 +0200

    perf script: Initialize callchain_param.record_mode

    Milian Wolff reported non functional DWARF unwind under perf script. The
    reason is that perf script does not properly configure
    callchain_param.record_mode, which is needed by unwind code.

    Stealing the code from report and leaving the place for more
    initialization code in a hope we could merge it with
    report__setup_sample_type one day.

    Reported-by: Milian Wolff <[email protected]>
    Signed-off-by: Jiri Olsa <[email protected]>
    Tested-by: Milian Wolff <[email protected]>
    Cc: David Ahern <[email protected]>
    Cc: Namhyung Kim <[email protected]>
    Cc: Peter Zijlstra <[email protected]>
    Link: http://lkml.kernel.org/r/[email protected]
    Signed-off-by: Arnaldo Carvalho de Melo <[email protected]>

diff --git a/tools/perf/builtin-script.c b/tools/perf/builtin-script.c
index 7b376d2..105332e 100644
--- a/tools/perf/builtin-script.c
+++ b/tools/perf/builtin-script.c
@@ -1561,6 +1561,22 @@ static int have_cmd(int argc, const char **argv)
        return 0;
 }

+static void script__setup_sample_type(struct perf_script *script)
+{
+       struct perf_session *session = script->session;
+       u64 sample_type = perf_evlist__combined_sample_type(session->evlist);
+
+       if (symbol_conf.use_callchain || symbol_conf.cumulate_callchain) {
+               if ((sample_type & PERF_SAMPLE_REGS_USER) &&
+                   (sample_type & PERF_SAMPLE_STACK_USER))
+                       callchain_param.record_mode = CALLCHAIN_DWARF;
+               else if (sample_type & PERF_SAMPLE_BRANCH_STACK)
+                       callchain_param.record_mode = CALLCHAIN_LBR;
+               else
+                       callchain_param.record_mode = CALLCHAIN_FP;
+       }
+}
+
 int cmd_script(int argc, const char **argv, const char *prefix __maybe_unused)
 {
        bool show_full_info = false;
@@ -1849,6 +1865,7 @@ int cmd_script(int argc, const char **argv, const char *prefix __maybe_unused)
                goto out_delete;

        script.session = session;
+       script__setup_sample_type(&script);

        session->itrace_synth_opts = &itrace_synth_opts;

By backporting this support from the 4.3 version of perf, we were able to support generation of Flame Graphs with our 4.1 production kernel tooling.

Conclusion

The moral of the story is: don’t count on well publicized perf features working on your older kernel. It is just as important to backport updates to the userspace perf tools as it is to backport updates for the production kernel itself.

Git workflow for upstreaming patches from a vendor kernel

Background

Upstreaming patches from a vendor kernel is a constant process of trying to get on board a train, falling behind, and hopping back on again.

Typically, a vendor kernel is based on an older version of the kernel. As a result, one has to forward port a series of patches against the latest kernel mainline. This is seldom a pain free affair, since the patches may not apply without manual edits. For example, the kernel interfaces may have changed, patches merged into mainline could have conflicting changes, and so on. On top of all of this, you have the reality that this task will need to be performed a number of times while you track mainline.

Basics

I usually perform cherry-picking of each patch on top of the mainline branch from the vendor branch, which is usually based on some old stable point release. Let’s assume that there are tags pointing to the vendor and stable commits, this reports the number of patches on top of that stable release.

panto@dev:~/linux (master)$ git describe stable
v4.1.15

panto@dev:~/linux (master)$ git describe vendor
v4.1.15-926-gea8c225

In this case, the patches are against stable v4.1.15 and there are 926 patches
on top of it; the format of the describe label is <tag>-<#-of-patches>-g<commit>

Workflow

First we get our needed information on the master branch.

panto@dev:~/linux (master)$ git describe master
v4.8-rc8-13-g53061af

Our master is today’s mainline kernel (v4.8-rc8) with just 13 patches on top of it. The problem with cherry-picking and manual editing is that when you edit the patch the commit id changes since the contents of the patch changes. We need a way to have a list of patches to cherry-pick, iteratively apply them, and manually fix any problems.

panto@dev:~/linux (master)$ git checkout --track -b work master
Checking out files: 100% (33262/33262), done.
Branch work set up to track local branch master.
Switched to a new branch 'work'

panto@dev:~/linux (work)$ git log --reverse --oneline stable..vendor >patchlist.txt

We create file with a list of the commits we want to apply on the work branch.

panto@dev:~/linux (work)$ cat patchlist.txt | head -n 2
ff24250 ppc: Make number of GPIO pins configurable
e4d443c pci/pciehp: Allow polling/irq mode to be decided on a per-port basis

This is the standard oneline format of git log (in reverse since we want the list to be in chronological order). If we were to do this manually, we’d have to do it like this:

panto@dev:~/linux (work)$ git cherry-pick ff24250 

If the cherry-pick is successful, we can proceed with the next one and so on. Otherwise, we have to manually fix it and issue git cherry-pick –continue Why not automate this by picking out the commit from the list and work iteratively? We can’t simply use commit IDs because the commit ID changes after every edit. The following cherry-pick-list.sh script does the heavy lifting of picking out the commits for us. Given the patchlist file, it will git cherry-pick each commit in the list. However, it will skip the already applied commits which match the description. It does not consider commit IDs since those might have changed.

#!/bin/bash

# get top
top=`git log --oneline HEAD^..HEAD | head -n1`
ctop=`echo ${top} | cut -d' ' -f1`
dtop=`echo ${top} | cut -d' ' -f2-`
l="$ctop $dtop"
if [ "$l" != "$top" ] ; then
        echo "Reconstructed top failure"
        echo $top
        echo $l
        exit 5
fi

# get list of commits and descriptions
old_IFS=${IFS}
IFS=$'n'

j=0
for i in `grep -v '^#' $1`; do
        c[${j}]=`echo ${i} | cut -d' ' -f1`
        d[${j}]=`echo ${i} | cut -d' ' -f2-`
        l="${c[${j}]} ${d[${j}]}"
        if [ $l != $i ] ; then
                echo "Reconstructed changeset failure $i"
                exit 5
        fi
        ((j++))
done
last=$((j - 1))
IFS=${old_IFS}

# skip over patches that are applied (checking description only)
match=0
for i in `seq 0 $last`; do
        ct=${c[${i}]}
        dt=${d[${i}]}
        if [ "${dt}" == "${dtop}" ]; then
                echo "Match found at $i: $dt"
                match=$(($i + 1))
                break;
        fi
        # echo "$i: $ct $dt"
done

for i in `seq $match $last`; do
        ct=${c[${i}]}
        dt=${d[${i}]}
        echo "cherry-picking: $i: $ct $dt"
        git cherry-pick $ct
        if [ $? -ne 0 ] ; then
                exit 5;
        fi
done

It makes sense to work on a simplified example using the kernel’s README file.

panto@dev:~/linux (work)$ git checkout --track -b foo master
Switched to branch 'foo'
Your branch is up-to-date with 'master'.

Edit the README file resulting to the following patch:

panto@dev:~/linux (foo)$ git diff
diff --git a/README b/README
index a24ec89..947fe6c 100644
--- a/README
+++ b/README
@@ -6,6 +6,8 @@ kernel, and what to do if something goes wrong.

WHAT IS LINUX?

+  foo
+
Linux is a clone of the operating system Unix, written from scratch by
Linus Torvalds with assistance from a loosely-knit team of hackers across
the Net. It aims towards POSIX and Single UNIX Specification compliance.

Commit the change:

panto@dev:~/linux (foo)$ git commit -m 'foo description'
[foo 4b5f122b] foo description
1 file changed, 2 insertions(+)

List the patches on top of master in sequence:

panto@dev:~/linux (foo)$ git log --oneline --reverse master..foo
4b5f122b foo description

Let’s create a new bar branch:

panto@dev:~/linux (foo)$ git checkout --track -b bar master
Switched to branch 'bar'
Your branch is up-to-date with 'master'.

Edit the README file resulting to the following patch:

panto@dev:~/linux (bar)$ git diff
diff --git a/README b/README
index a24ec89..4e7043c 100644
--- a/README
+++ b/README
@@ -6,6 +6,8 @@ kernel, and what to do if something goes wrong.

WHAT IS LINUX?

+  bar
+
Linux is a clone of the operating system Unix, written from scratch by
Linus Torvalds with assistance from a loosely-knit team of hackers across
the Net. It aims towards POSIX and Single UNIX Specification compliance.

Note that this conflicts with the foo patch, we will need to manually fix it later.

Commit the change:

panto@dev:~/linux (bar)$ git commit -m 'bar description'
[bar aba1679] bar description
 1 file changed, 2 insertions(+)

Make another commit that is conflict free:

panto@dev:~/linux (bar)$ git diff

diff --git a/README b/README
index 2788bfc..fbdf488 100644 
--- a/README
+++ b/README 
@@ -412,3 +412,4 @@ IF SOMETHING GOES WRONG:
gdb'ing a non-running kernel currently fails because gdb (wrongly)
disregards the starting offset for which the kernel is compiled.

+   more bar

Switch back to the foo branch to apply the changes in the bar branch.

panto@dev:~/linux (bar)$ git checkout foo
Switched to branch 'foo'
Your branch is ahead of 'master' by 1 commit.
  (use "git push" to publish your local commits)

Generate the patchlist file:

panto@dev:~/linux (foo)$ git log --oneline --reverse master..bar | tee patchlist.txt
22d7ac6 bar description
2be1bbb more bar description

Apply them using the script:

panto@dev:~/linux (foo)$ cherry-pick-list.sh patchlist.txt  
cherry-picking: 0: 22d7ac6 bar description
error: could not apply 22d7ac6... bar description
hint: after resolving the conflicts, mark the corrected paths
hint: with 'git add <paths>' or 'git rm <paths>'
hint: and commit the result with 'git commit'
Recorded preimage for 'README'

panto@dev:~/linux (foo)$ git diff
diff --cc README
index 947fe6c,4e7043c..0000000
--- a/README
+++ b/README
@@@ -6,7 -6,7 +6,11 @@@ kernel, and what to do if something goe

WHAT IS LINUX?

++<<<<<<< HEAD
+  foo
++=======
+   bar
++>>>>>>> 22d7ac6... bar description

Linux is a clone of the operating system Unix, written from scratch by
Linus Torvalds with assistance from a loosely-knit team of hackers across

Edit and fix it to look like this:

panto@dev:~/linux (foo)$ git diff
diff --cc README
index 947fe6c,4e7043c..0000000
--- a/README
+++ b/README
@@@ -6,7 -6,7 +6,8 @@@ kernel, and what to do if something goe

WHAT IS LINUX?

+  foo
+   bar

Linux is a clone of the operating system Unix, written from scratch by
Linus Torvalds with assistance from a loosely-knit team of hackers across

panto@dev:~/linux (foo)$ git add README

Edit the commit message (leaving the conflict or removing the Conflicts: tag)

panto@dev:~/linux (foo)$ git cherry-pick continue
Recorded resolution for 'README'.
[foo cc9dc34] bar description
1 file changed, 1 insertion(+)

Note the Recorded resolution line. Next time we will perform the same operation so we don’t have to repeat the manual fix. Run the script again to pick up the rest of the patchlist.

panto@dev:~/linux (foo)$ git cherry-pick continue
Match found at 0: bar description
cherry-picking: 1: 2be1bbb more bar description
[foo 63c1973] more bar description
 1 file changed, 1 insertion(+)

Note the message Match found at 0:. The script picked up that the first commit has been applied (albeit manually edited) and continued with the rest, which apply without problems. List the patches on top of master on the foo branch. Note that the commit ids of the patch sequence have changed.

panto@dev:~/linux (foo)$ git log --oneline --reverse master..
4b5f122b foo description 
cc9dc34 bar description
63c1973 more bar description

Now if we reset the foo branch back to the starting point:

panto@dev:~/linux (foo)$ git reset --hard HEAD^^
HEAD is now at 4b5f122b foo description

Try to apply the patchlist again to see what happens:

panto@dev:~/linux (foo)$ cherry-pick-list.sh patchlist.txt
cherry-picking: 0: 22d7ac6 bar description
error: could not apply 22d7ac6... bar description
hint: after resolving the conflicts, mark the corrected paths
hint: with 'git add <paths>' or 'git rm <paths>'
hint: and commit the result with 'git commit' 
Resolved 'README' using previous resolution.

Note the Resolved ‘README’ using previous resolution. This means that git determined that we are trying to perform the same edit and already made the change for us. Of course, it didn’t commit the change so that we have a chance to verify that it is correct.

panto@dev:~/linux (foo)$ diff --cc README
index 947fe6c,4e7043c..0000000
--- a/README
+++ b/README
@@@ -6,7 -6,7 +6,8 @@@ kernel, and what to do if something goe

WHAT IS LINUX?

+  foo
+   bar

Linux is a clone of the operating system Unix, written from scratch by
Linus Torvalds with assistance from a loosely-knit team of hackers across

Just add the changed file as earlier:

panto@dev:~/linux (foo)$ git add README 
panto@hp800z:~/juniper/linux-medatom.git (foo)$ git cherry-pick --continue
[foo 2586dba] bar description
 1 file changed, 1 insertion(+)

Use the script again and end up at the same result:

panto@dev:~/linux (foo)$ ./cherry-pick-list.sh patchlist.txt 
Match found at 0: bar description
cherry-picking: 1: 2be1bbb more bar description
[foo 6641dd4] more bar description
 1 file changed, 1 insertion(+)

I’m not a regular git guru but I found out that this small script ended up saving me a large amount of repetitive work. I hope someone else will find this useful.

GPGPU Offload Phase 1

Overview

As part of an ADAS project using embedded Nvidia GPUs, we are conducting an investigation into the current state of GPGPU support including development, debug, and performance analysis tools starting with Nvidia GPUs. Since large customer proprietary applications can be diffcult to work with, we needed a simpler test case we could modify and extend. We decided to make an open source test application that has some of the charactersitics of a typical production ADAS application. Since there is a lot of public research into lane detection and warning systems, as well as some bits of free software available to leverage in implementation, we chose to make a simple Lane Departure Warning System (LDWS) application.

Lane Departure Warning System Overview

Overview

LDWS is an OSS application which serves as our test bed for GPGPU tool evaluation. The phase 1 version can be found on the ldws-p1 branch in the LDWS repository. LDWS is a C++ application developed using OpenCV 3 and is under a mix of Apache and MIT licenses. Complete build and use documentation can be found in the project README.

Requirements

The phase 1 requirements are:

  • Run on Linux desktop system with Nvidia GPU
  • Be written in C/C++
  • Leverage both OpenCV and existing FOSS lane detection projects
  • Accept video input from Xle
  • Detect lanes in video and highlight the current lane
  • Detect position in lane and warn if crossing lane marker
  • Lane detection and warning need only be good enough quality to demonstrate concept
  • Support two different test videos
  • Support CPU only and OpenCL offload modes via runtime selection
  • Display realtime and average frames per second

Design

LDWS is implemented as a C++ application leveraging cmake for build, OpenCV 3 for image processing, tclap for command line arg processing, and libconfig++ for configuration file processing. It is composed of a main video handling loop, a configuration storage class, and a lane detection class.

On initialization a config store is instantiated which reads all configuration variables from combination of command line options and configuration file options. A file or capture device is opened to provide the video feed to the video handler. Each video frame is then processed using a sequence of algorithms to detect a set of lines present. Using the detected lines, the ProcessLanes() method of the LaneDetector class then determines lane boundaries and draws the detected boundaries on the video for output. The video handler computes frames per second values and draws the processed video frame before fetching another frame of input video.

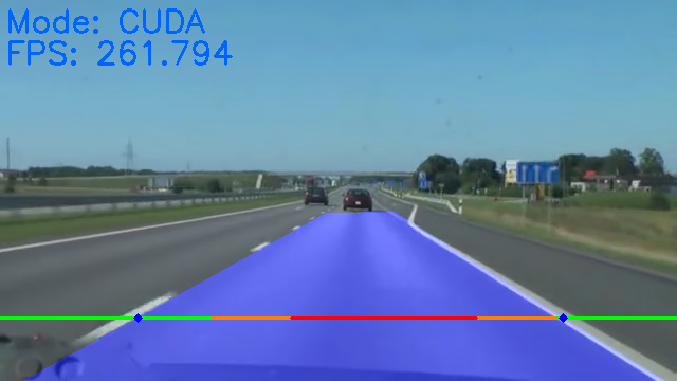
LDWS in CUDA mode with dual lane test video

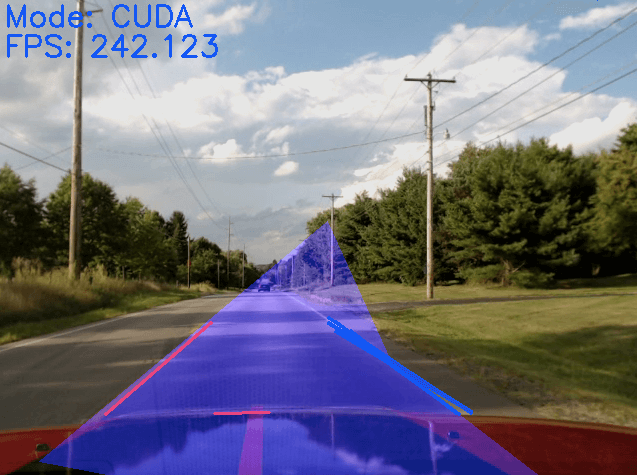
During development it was decided it was better to pull a Phase 2 requirement of CUDA support into Phase 1 so LDWS supports runtime switching (via a command line switch) between CPU-only, OpenCL-offload, and CUDA-offload. LDWS displays the mode as CPUOpenCL, or CUDA during execution as well as the per-frame FPS value measured. At completion of a video input file, LDWS prints the average FPS maintained during the entire run.

The basic image processing algorithms that LDWS employs are:

LDWS leverages the lane detection algorithm implemented in the opencv-lane-vehicle-track project and the lane departure warning algorithm implemented in the Python-based Lane Departure Warning project. The lane detection algorithm performs a simple angular filtering of lines followed by a selection of the best line based on distance of points from midpoint. The lane departure sensing using a simple line crossing methodology. A horizontal meter line is drawn on the display with the current crossing points of the detect lane marker edges tracked by dots on each end of the meter. If the positioning dots move too far either direction on the meter then a threshold event indicates that the vechicle is moving out of the lane.

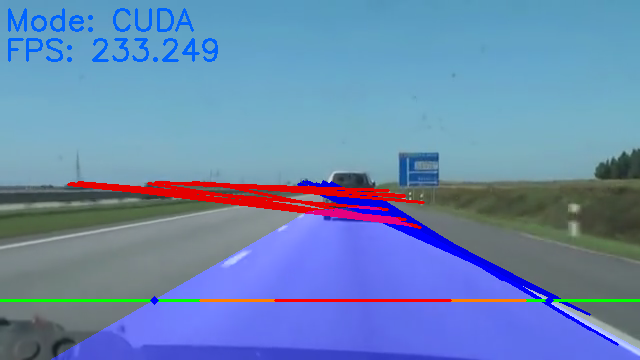
LDWS provides a command line option to enable display of intermediate video frame data during each step of the image processing sequence. These screenshots show the detected edges and lines, respectively, for one frame of video.

Canny edge detector output
Hough transform line detector output

Limitations and Improvements

The simple algorithms employed result in only a good enough quality lane detection system. Use of Canny edge and Hough line detection from a vehicle mounted camera perspective is highly susceptible to shadows from trees and other overhead objects on the road as well as being poor in low-light or night conditions. Note the shadows in the following frame on a sunny day.

Road with shadows from overhead objects

Notice how the Canny edge detector finds the horizontal edge of the shadows in the region of interest.

Shadow lines from Canny edge detector

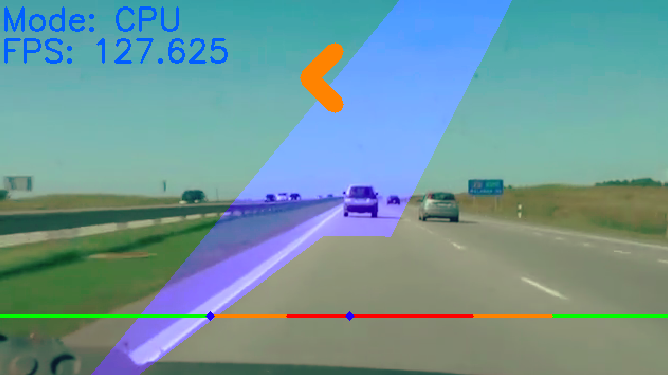
The lane detection algorithm itself assumes the vehicle is always at the midpoint on the image which is not the case when changing lanes so the algorithm with vote up lines during lane changes that are not actually lane markers. The result of all of these factors means that the application suffers from losing track of lane markers in all but ideal conditions. The following is an example of it losing sync periodically.

LDWS loses sync, unable to detect the right lane marker

Functional improvements can be made by employing one or more of the following methodologies:

Some or all of these approaches are generally combined with the existing basic Canny edge and Hough transform algorithms for a production grade system.

Performance

Background

Describe three modes of operation and limits of tools.

Summary

Explain perf stat CPU utilization and in-app FPS figures.

ModeCPU%FPS
CPU87.2339.3
CUDA87.2359.8
OpenCL195.4235.0

Analysis

The basis of our performance analysis centers around statistical sampling using the Linux perf tool. We start by examining the CPU mode case in the following perf report fragment. The important aspect to note is the top offender in our application with is the call to cv::HoughLinesProbabilistic. That is by far the biggest consumer of CPU cycles in the application. This is completely expected as our lane detection algorithm heavily relies on detecting all lines in each frame of the video feed. You may notice other curious consumers of CPU time in libQt5Gui and libavcodec-ffmpeg.so. These are all products of the display of each resulting frame to the UI and capture/decode of video frames from our source video feed. Since we are only concerned about the portion of our ADAS algorithms that could be offloaded to a GPU, we discard these areas as out-of-scope for this particular project. In a production system, we would avoid using inefficient OpenCV blending/drawing paths and would utilize hardware assisted decode of video frames.

#       Overhead       Samples  Command / Shared Object / Symbol
# ............................  ...................................................................................................................................................
#
    99.67%          5551        ldws
       32.34%          1441        libopencv_imgproc.so.3.1.0
          21.51%           856        [.] cv::HoughLinesProbabilistic
            |
             --21.48%--_start
                       __libc_start_main
                       main
                       cv::HoughLinesP
                       cv::HoughLinesProbabilistic

           2.40%           252        [.] cv::CvtColorLoop_Invoker<cv::RGB2Gray<unsigned char> >::operator()
            |
            ---__clone
               start_thread
               cv::ForThread::thread_loop_wrapper
               cv::CvtColorLoop_Invoker<cv::RGB2Gray<unsigned char> >::operator()

           2.11%            77        [.] cv::FillConvexPoly
            |
             --2.06%--_start
                       __libc_start_main
                       main

       28.67%          1048        libQt5Gui.so.5.6.1
           2.54%            91        [.] 0x00000000002f3a13
            |
            ---0x7f0b431dfb26
               0x7f0b431e3012
               0x7f0b431bca13

       12.49%           765        libavcodec-ffmpeg.so.56.60.100
                                      no entry >= 2.00%
        5.12%           204        libopencv_core.so.3.1.0
           4.55%           164        [.] cv::hal::addWeighted8u
            |
            ---_start
               __libc_start_main
               main
               LaneDetector::ProcessLanes
               cv::addWeighted
               cv::arithm_op
               cv::hal::addWeighted8u

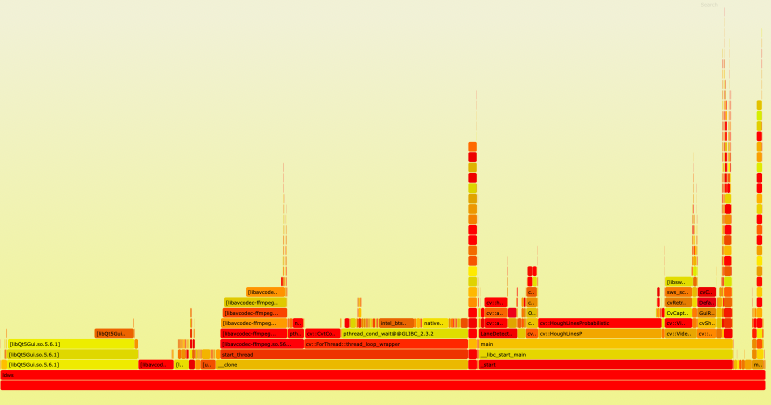
Another way to visualize our CPU usage is in the following Flamegraph. Note that the widest elements in the graph are the hot spots in CPU utilization. If we again discard the video input and UI areas, it can be seen that the cv:HoughLinesProbabilistic() is the top offender. Just to the left, it can be seen that LaneDetector::ProcessLanes() is a close second. We know from our development of the lane detection algorithm that the ProcessLanes() functionality is not going to be offloaded as it is basic post processing of the lines gathered from the Hough transform.

Dual lane CPU Flamegraph

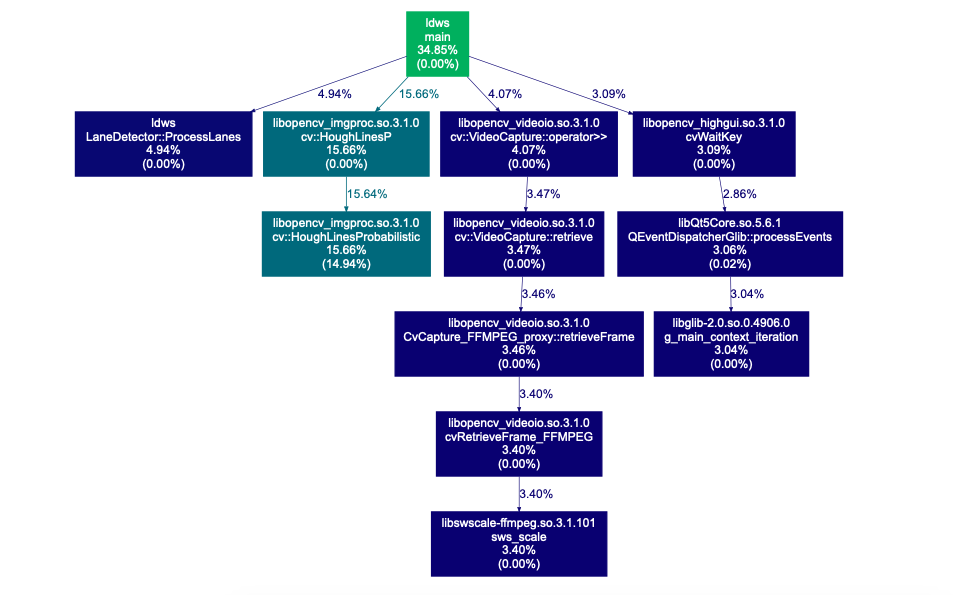
Another way to look at our application is with a traditional callgraph. By zooming in on our area of concern, we get the results seen in the following diagram. Once again, excluding those paths on the right that are out-of-scope, we can clearly see that cv::HoughLinesProbabilistic is a great place to focus on performance improvements.

Dual lane CPU Callgraph